Using the Green Area Index to Assess Nitrogen in Crops
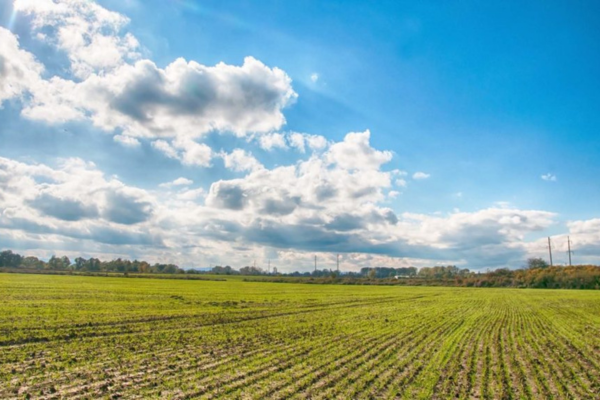
23 February 2024Cold and waterlogged soils have meant many winter crops have been slow to get going, particularly those which were later drilled.
With many growers itching to get onto winter crops with first applications of bagged nitrogen, the below article examines the importance of monitoring green area index (GAI).
Assessing Winter Cereals
Green area index (GAI) is a useful tool, which can be used by growers both at the beginning of spring and later in the growing season, to estimate how much nitrogen the crop has successfully taken up, ultimately providing an indication as to whether crops are deficient in nitrogen or are adequately supplied.
Throughout the growing season, nitrogen will be supplied from several different sources, including soil residual nitrogen (nitrogen which if left over from the previous crop), historic applications of manures/compost and finally nitrogen from bagged fertiliser applications.
There are several methods used to measure GAI. These methods include tractor mounted sensors, handheld Nitrogen sensors, mobile apps and leaf tissue tested in a lab. The most basic method is by eye, looking at your crop canopy and comparing to the AHDB reference photos and GAI benchmarks for each growth stage.
For every 1 unit of GAI it is estimated that the crop canopy contains 36Kg/ha nitrogen.

Graph 1: GAI targets over the growing season (AHDB wheat growth guide)
The graph above shows the AHDB benchmark GAI over the growing season. The graph shows that most nitrogen is taken up during the construction phase, where following growth stage 31 (GS31), the target is for an increase of 1 unit of GAI every 9 days.

Picture 1: GAI reference photos for winter wheat GS24-GS30 (AHDB wheat growth guide)
The pictures above show the typical GAI, which can be expected during tillering. This winter soils have remained cold and waterlogged, which has left many crops entering spring looking backward.

Picture 2: GAI reference photos for winter wheat GS31 (AHDB wheat growth guide)
Later in the season, the AHDB GAI benchmark for GS31 is 2.0. When GAI is exceeded (as shown in the above pictures), it may be an indication that nitrogen has been over supplied or applications poorly timed (Too much nitrogen applied too early).
Full information regarding nitrogen recommendations and timings of nitrogen applications for cereals can be found on technical note TN731. https://www.fas.scot/publication/technical-note-tn731-nitrogen-recommendations-for-cereals-oilseed-rape-and-potatoes/
For farms within an NVZ area it is essential that N Max limits and all other NVZ rules regarding closed periods are adhered to. https://www.gov.scot/publications/nitrate-vulnerable-zones-guidance-for-farmers/
George Gauley, SAC Consulting
Sign up to the FAS newsletter
Receive updates on news, events and publications from Scotland’s Farm Advisory Service


